Skip to content
WEGMSTUDIO
Insight Analytics website design
Custom ProjectsID: WGM074

A working D2C sales dashboard demo, ready to be wired to your real store data.

Insight Analytics

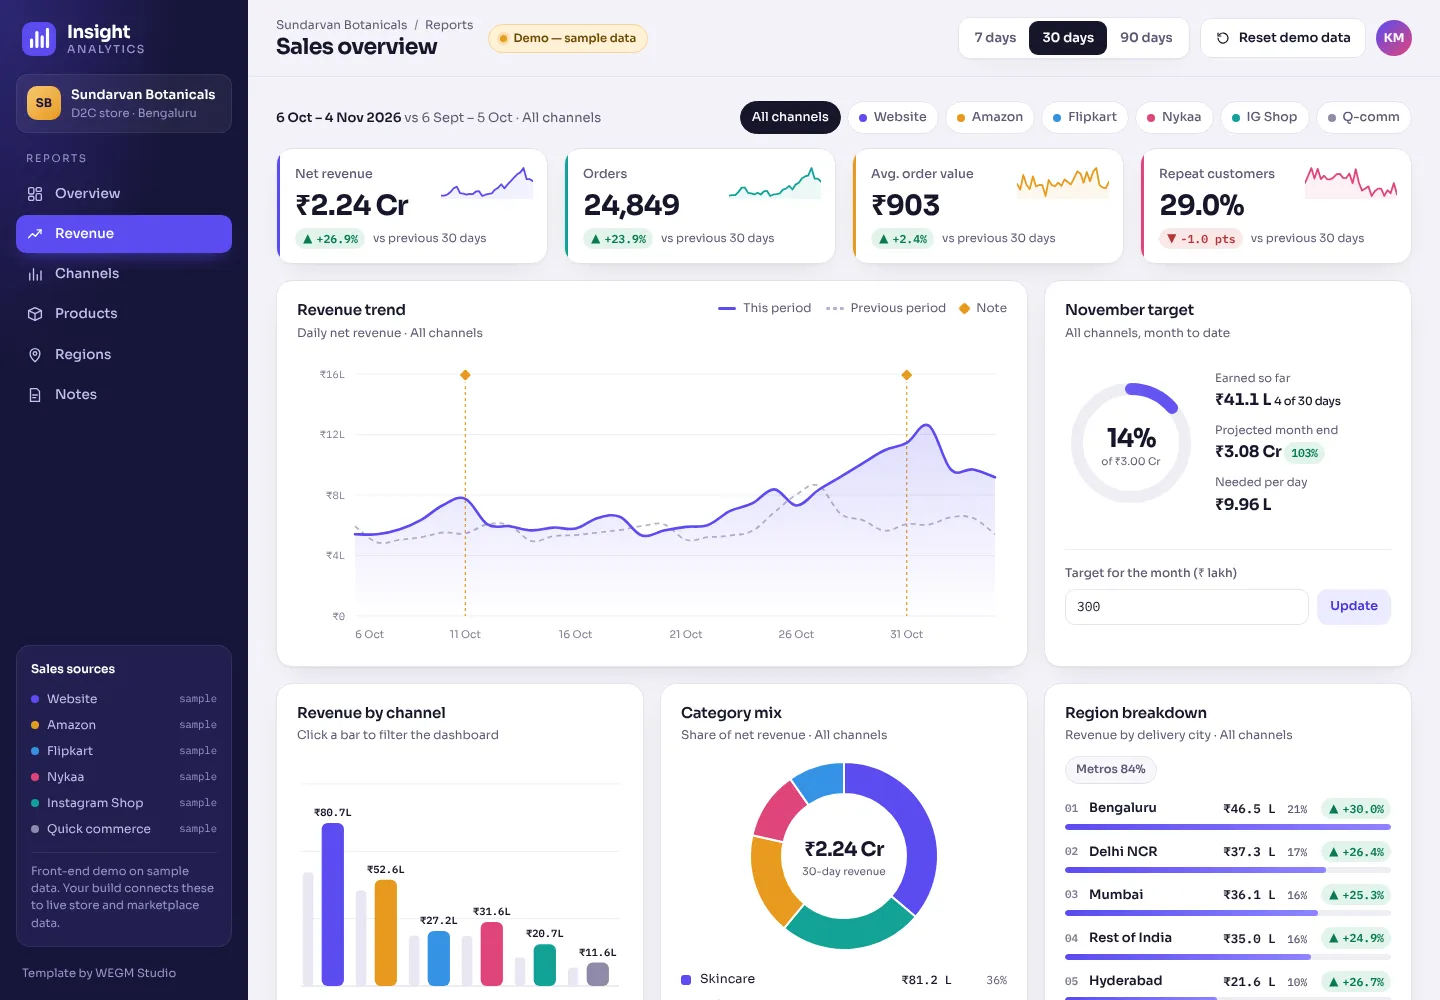
Front-end demo of a sales analytics dashboard for a D2C brand: KPI cards, revenue trend, channel, category and region reports, a sortable top-products table with CSV export, a monthly target and notes.

Starting at

₹999

Includes customisation with your content. Final price depends on changes.

What's included

  • 7, 30 and 90 day range switch that recalculates the KPIs, charts, regions and products table against the previous period
  • Channel filter chips, and clickable channel bars, that filter KPIs, revenue line, category donut, regions and products
  • SVG revenue line chart with a dashed previous-period line, hover tooltips and arrow-key reading of daily values
  • SVG bar chart by sales channel and SVG category donut, both with hover and focus tooltips
  • Top products table that sorts by any column, with search, category filter, starred filter and top 10 or show all
  • Export CSV button that downloads the rows currently shown in the table as a Blob file
  • Monthly target ring with month-to-date revenue, projected month end and revenue needed per day; target is editable
  • Dated notes you add or delete, pinned as markers on the revenue chart
  • Region breakdown for seven metro cities and the rest of India, with share of revenue, change and metro share
  • Range, filters, sort, stars, notes and target saved in localStorage, with a Reset demo data button

Pages included

  • Dashboard — Sidebar, Top bar, Channel filters, KPI cards, Revenue trend, Monthly target, Revenue by channel, Category mix, Region breakdown, Top products, Notes
Mobile responsiveHTML5CSS3JavaScriptSVGGoogle FontslocalStorage

Try the live website

This is the real site running — scroll, click and switch devices.

Loading live preview…

About this template

Insight Analytics is a single-page sales dashboard for a direct-to-consumer brand. A dark indigo sidebar holds the section links and sales sources, and the top bar carries a 7, 30 or 90 day range switch, a Demo badge and Reset. Below sit four KPI cards, a revenue trend chart beside a monthly target ring, a channel bar chart, a category donut, a region breakdown, a top-products table and a notes panel. This is a front-end demo: it runs in the browser on sample data generated in script.js for the fictional brand Sundarvan Botanicals, and the studio connects it to your real store and marketplace data as a custom project. The range switch redraws the KPI cards, charts, regions and table against the period before, and channel chips or a click on a bar filter the whole dashboard. Charts have hover tooltips, the table sorts by any column and exports the visible rows as CSV, and notes and the target are saved in localStorage. The brand, products and figures are placeholders the studio replaces with yours. The palette pairs a deep indigo rail with a lavender-grey canvas and violet, teal, saffron, rose and sky data colours, set in Sora with IBM Plex Mono for figures. Bars grow and the line draws in, with motion off for reduced-motion users. Below 900 px the sidebar becomes a bottom tab bar and the grid steps down to one column. It suits D2C founders, growth teams and agencies who want a working dashboard prototype to agree on before the data work starts.

Design highlights

  • Midnight indigo sidebar on a lavender-grey canvas, with violet, teal, saffron, rose and sky chart colours
  • Sora for the interface and IBM Plex Mono for axis labels, table figures and deltas
  • All charts are hand-drawn SVG from plain JavaScript, with no chart library
  • Bars grow, the revenue line draws in and the target ring fills; motion is off for reduced-motion users
  • Sidebar turns into a bottom tab bar under 900 px and the card grid goes from three columns to one

Who it's for

D2C and e-commerce brands selling through their own site and marketplaces, founders and growth leads who track revenue by channel, product and city, and agencies who need a clickable dashboard to agree scope with a client before the studio builds the custom backend and data connections.

Related templates

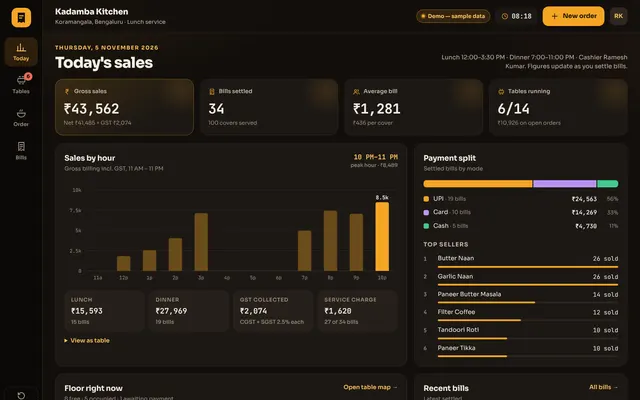
A front-end demo of a restaurant point-of-sale with a live table map, menu grid by category, an order cart with 5% GST and service charge, printable KOT and bill, and today's sales.

Starting at

₹999
TaskBoard

WGM118

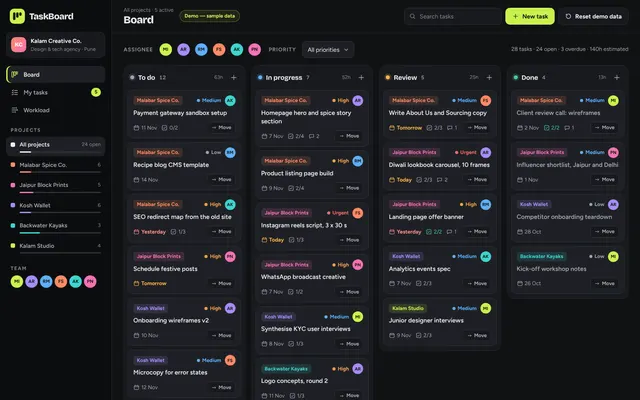
Front-end demo of a project management app for an agency: projects sidebar, drag-and-drop kanban with a keyboard Move menu, task details with checklist and comments, assignee and priority filters, My tasks and a workload chart.

Starting at

₹999

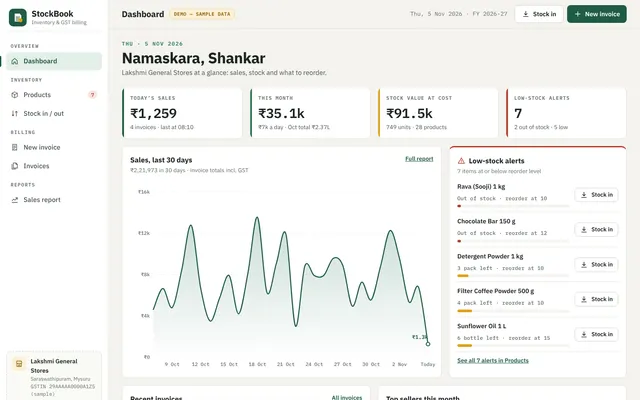
Front-end demo of shop inventory and GST billing on sample data: products with low-stock alerts, stock in/out ledger, an invoice builder with CGST/SGST split and print-ready invoices, and sales reports.

Starting at

₹999